Random Billing analysis update: over 10,000 meter readings entered for over 270 local utility customers.
Tuesday, November 26, 2013
ASHRAE 62.2 dog owner implications?
I've joked that there should be some exemption/credit in the ASHRAE 62.2 standard for dog owners letting their dog out to 'get some fresh air'. After hearing this story about revolving doors and the energy/infiltration impacts of door openings, there might be something to it!
Tuesday, November 5, 2013
Pricing out tiered utility rate structures
I've gotten a few questions about how to determine annual energy costs when utilities have a tiered rate structure. Here is a walk through for one method of modeling the annual electric costs.
This model assumes that the house is NOT heated with electricity and that there is a summer cooling load. So if the house is located in the Indianapolis, Evansville, or Cincinnati weather regions, this modeling would be appropriate. If your homes are located in the Chicago, South Bend, or Fort Wayne regions, a smaller cooling load might be more appropriate. If there is a need for this manner of modeling from the northern areas, I'll work on that later.
This table shows an assumed monthly allocation of how much electricity is consumed each month. The percent allocation show below is what was used in the most recent DOE priority list run. That analysis was based on the average electric consumption during the 2009-2010 evaluation period: 11,323 kWh.
This breakdown can then be used to determine the monthly bills of the hypothetical utility customer. The sum of the 12 monthly bills divided by the number of kWh used during those twelve months (11,323) will tell what the average cost per kWh is for the purpose of NEAT & MHEA.
Update:
The following is a similar benchmark to use for determining average annual fuel costs for the small handful of natural gas providers that are not Vectren, NIPSCO, or CEG. These are the monthly consumption amounts that can be used to determine the annual fuel costs (along with the utility rate tariffs):
This model assumes that the house is NOT heated with electricity and that there is a summer cooling load. So if the house is located in the Indianapolis, Evansville, or Cincinnati weather regions, this modeling would be appropriate. If your homes are located in the Chicago, South Bend, or Fort Wayne regions, a smaller cooling load might be more appropriate. If there is a need for this manner of modeling from the northern areas, I'll work on that later.
This table shows an assumed monthly allocation of how much electricity is consumed each month. The percent allocation show below is what was used in the most recent DOE priority list run. That analysis was based on the average electric consumption during the 2009-2010 evaluation period: 11,323 kWh.
| Monthly profile | % of annual consumption | Monthly Consumption | ||
| January | 0.068 | 769.964 | ||
| February | 0.051 | 577.473 | ||
| March | 0.05 | 566.15 | ||
| April | 0.051 | 577.473 | ||
| May | 0.06 | 679.38 | ||
| June | 0.115 | 1302.145 | ||
| July | 0.17 | 1924.91 | ||
| August | 0.142 | 1607.866 | ||
| September | 0.103 | 1166.269 | ||
| October | 0.063 | 713.349 | ||
| November | 0.063 | 713.349 | ||
| December | 0.064 | 724.672 | ||
| Total | 1.000 | 11323 | ||
This breakdown can then be used to determine the monthly bills of the hypothetical utility customer. The sum of the 12 monthly bills divided by the number of kWh used during those twelve months (11,323) will tell what the average cost per kWh is for the purpose of NEAT & MHEA.
Update:
The following is a similar benchmark to use for determining average annual fuel costs for the small handful of natural gas providers that are not Vectren, NIPSCO, or CEG. These are the monthly consumption amounts that can be used to determine the annual fuel costs (along with the utility rate tariffs):
| Monthly profile | therms |
| January | 169.671 |
| February | 140.408 |
| March | 113.366 |
| April | 65.9213 |
| May | 32.7063 |
| June | 13.425 |
| July | 10.2859 |
| August | 10.8714 |
| September | 21.7202 |
| October | 58.3251 |
| November | 106.783 |
| December | 153.517 |
| Total | 897 |
Sunday, November 3, 2013
Second quarter status - BEACon
This year's energy impact report is progressing along. Several successful test runs have taken place using BEACon with consumption data from Vectren. Preliminary results have been sent to Weatherization providers based on those test runs with the Vectren data. So some programs already have feedback on homes that were weatherized, shortening the time between completion and savings results.
There is still progress to be made on how to best incorporate the pre-weatherization consumption data back into the IWAP database. Conversations are on going between IHCDA, Roeing, and INCAA to determine the best way to proceed.
So far requests for data have been made to nearly half of the state's metered fuel providers (54 providers, 45 percent). Of those 54 providers, 40 have returned consumption data (34 percent). And of those that have returned consumption data, 25 have had the data converted into a format usable by BEACon. Both Vectren and Citizens Energy Group have returned consumption data.
The next major tasks are re-establishing data request procedures with NIPSCO, IPL, I&M, and Duke. Data requests to the remaining electric and natural gas fuel providers will continue, as will converting the returned consumption data into a BEACon friendly format.
Update: consumption data has been entered for 170 non-investor owned utility customers consisting of over 6,000 meter readings at this time.
Thursday, September 26, 2013
Preliminary BEACon results - Vectren
While little bits of missing data are being collected and sent back, BEACon has been put through a couple test runs with limited datasets. Due to Vectren's fantastic cooperation by providing a speedy and secure turn-around for data, the early test runs are all based on Vectren customers. That said, here are some preliminary rankings of top savers:


Please bear in mind that these savings results are gross results. The provider savings results will almost definitely be lower after factoring in the comparison groups for each provider when the final provider reports are completed.
Again, these percent savings results are gross, without any comparison group factored in. So the savings results will be a bit lower (or could be totally different if your provider has other natural gas companies that have not been analyzed - NIPSCO, Ohio Valley Gas, Citizens Gas, etc.).
Preliminary provider reports will be coming out and sent to the providers very soon based on these initial runs. Hopefully the feedback they provide will be more relevant being distributed before March!
Thursday, September 12, 2013
Patents in the residential energy business
Please take a moment to read this article, touching on 'business method' patents.
So what does that have to do with energy conservation?
This
The good news is that home inspectors (ASHI) are now looking into the issue since a suit has been filed (and ruled on). The comments section of the GBA article are rather educational as well and worth a read. I wonder if the folks in Mississippi realize those methods have been used in some way or another for at least two decades prior to their patent in thousands of homes?
Thursday, August 29, 2013
BEACon is out of beta!
The first test run of consumption data from the 2011 - 2012 evaluation period was run on a small section of data from Vectren this morning. Another larger run should be completed next week. The quicker the additional information comes back in from all the CAPs, the quicker the formal requests for data can be made to all the utility vendors.
I will do my best to share the weather normalized consumption data with Roeing so it can be fed back into the Weatherization database's waiting list in a timely manner!
I will do my best to share the weather normalized consumption data with Roeing so it can be fed back into the Weatherization database's waiting list in a timely manner!
Saturday, August 3, 2013
Beginnings of the 2011-2012 Billing Analysis report
The 2011-2012 billing analysis report is slowing inching forward. Requests for missing information have been sent out to program managers. Once those have all been returned, the utility data requests can begin. In the mean time, here is a breakdown of provider production during the reporting period.

Fifty seven percent of the homes weatherized were done by the legacy providers and 43% were weatherized by the new providers. The six most productive providers weatherized about half (50.5%) of all the homes in Indiana:
- Indiana Builders Association - 1,852
- Northwest Indiana Community Action - 481
- Hoosier Energy REC - 412
- Real Services - 375
- Community Action of Northeast Indiana - 287
- South Central Community Action Program - 280
Tuesday, July 30, 2013
But can you dense pack with it?
Two Rensselaer Polytechnic Institute grads are trying to turn a part of mushrooms into an insulation material. Not the whole mushroom, just the mycelium.
I don't know, just something about mold in a house seems funny to me. I know it isn't really mold, but a part of the mold.

The new start up, Ecovative Design is working on a SIPs-like product that has some filler material between the structural panels. The mycelium feeds on that filler, growing in to fill the space while leaving behind a stronger, somewhat foam-like insulation behind. Only there are no blowing agents involved, which is rather un-foam-like. No harmful VOCs to off-gas!
I don't know, just something about mold in a house seems funny to me. I know it isn't really mold, but a part of the mold.
The new start up, Ecovative Design is working on a SIPs-like product that has some filler material between the structural panels. The mycelium feeds on that filler, growing in to fill the space while leaving behind a stronger, somewhat foam-like insulation behind. Only there are no blowing agents involved, which is rather un-foam-like. No harmful VOCs to off-gas!
Sunday, June 30, 2013
An interesting insight into the sausage making of mechancial ventilation standards...
Indiana's Weatherization program has been incorporating ASHRAE 62.2-2010 for just over a year and a half now with some pushing from DOE. As can be expected of any change, there were some CAPs that wanted to learn how to do it, and do it well. Others were skeptical and a little resistant to change.
Nothing new or outrageous about any of that.
This article at Green Building Advisor gives some insight between the difference of lowly anti-poverty energy conservation program's abilities compared to those of the New Home Construction industry.
I'm not surprised if anyone is a little confused reading the article. I was the first time I read it as well. "Oh great, now we've got to put in even bigger fans!" ran through my head. "After all, Lstiburek wouldn't throw a fit unless it is a fit worth throwing..."
But the clarification comes a little further down:
Now, this should look a little more familiar (but not totally). Or maybe not if you don't look at the back end math of the current 62.2 calculator we've been using in Indiana. The formula above is from the 2013 version of ASHRAE 62.2. Indiana is currently using the 2010 version of ASHRAE 62.2.
The nuance of the difference between 2010 and 2013 aren't the point. Bottom line, Indiana's rag-tag group of Weatherization techs are able to maneuver this fan sizing process day in, day out. While sophisticated new home Builders can't seem to be able to put a blower door in a new home, do some multiplication, and turn a dial in a fan housing.
I do enjoy these little situations where the weatherization 'industry' here in Indiana has its act together better than what could be found in almost any new home. It is a little sad for the state of new homes. But it is something for our weatherization program to be a little proud about.
If anyone is a little skeptical about the impacts a properly sized whole house ventilation system can have, try installing one in your home. The difference isn't big, but it is the little things that aren't there any more. Leaving for a day or two and the house doesn't smell like stuffy house is my personal favorite...
Nothing new or outrageous about any of that.
This article at Green Building Advisor gives some insight between the difference of lowly anti-poverty energy conservation program's abilities compared to those of the New Home Construction industry.
I'm not surprised if anyone is a little confused reading the article. I was the first time I read it as well. "Oh great, now we've got to put in even bigger fans!" ran through my head. "After all, Lstiburek wouldn't throw a fit unless it is a fit worth throwing..."
But the clarification comes a little further down:
Defenders of the new ASHRAE formula point out that the newest version of the standard provides an alternate method of calculating the minimum ventilation rate — a method that may restore at least some of the infiltration credit.The alternate calculation method requires that the home must be tested with a blower door. Once that’s done, and you have a cfm50 result from the blower-door test, you can get an infiltration credit that may reduce the need for mechanical ventilation. You have to use the following formula:
Infiltration credit = 0.052 • cfm50 • (story factor) • (weather factor)The story factor is the number of stories raised to the 0.4 power. So, for a one-story building, the story factor is 1; for a 1 1/2 story building, the story factor is 1.18; for a 2-story building, the story factor is 1.32; for a 2 1/2 story building, the story factor is 1.44; and for a 3-story building, the story factor is 1.55.What’s that you say? You’re not sure what your weather factor is? You'll have to look it up from a list of 1,100 locations.
Now, this should look a little more familiar (but not totally). Or maybe not if you don't look at the back end math of the current 62.2 calculator we've been using in Indiana. The formula above is from the 2013 version of ASHRAE 62.2. Indiana is currently using the 2010 version of ASHRAE 62.2.
The nuance of the difference between 2010 and 2013 aren't the point. Bottom line, Indiana's rag-tag group of Weatherization techs are able to maneuver this fan sizing process day in, day out. While sophisticated new home Builders can't seem to be able to put a blower door in a new home, do some multiplication, and turn a dial in a fan housing.
I do enjoy these little situations where the weatherization 'industry' here in Indiana has its act together better than what could be found in almost any new home. It is a little sad for the state of new homes. But it is something for our weatherization program to be a little proud about.
If anyone is a little skeptical about the impacts a properly sized whole house ventilation system can have, try installing one in your home. The difference isn't big, but it is the little things that aren't there any more. Leaving for a day or two and the house doesn't smell like stuffy house is my personal favorite...
Thursday, May 30, 2013
New digital forms have been uploaded
Just in case you have stumbled here before Ray sends an email out, the latest versions of the digital job books have been uploaded to the Intelligent Weatherization forms page.
Incidental Repair Costs
The most significant change to the work orders are the new way incidental costs are treated. There are now incidental cost spending limits specific to each activity based on how cost effective that conservation measure is. The more cost effective the activity is, the more that can be spent on incidental costs associated with performing that activity. But don't forget, the $500 total incidental cost limit still applies!
For example, there is a 1000 sqft attic with no insulation, but it has some water coming in around the roof's chimney penetration. Just to throw a number out there, lets assume there is $900 worth of insulation that you want added to the attic. Based on the spending limits, you could spend up to $1,377 on incidental repairs before the attic insulation is no longer cost effective. However, you cannot spend that full amount, because the $500 total incidental cost limit applies for the entire job! Don't overspend!
Likewise, there is a small addition on the back of the house that has a water heater vent going through the roof. There happens to be a roof leak around the water heater vent's roof jack. You'd like to insulate the little uninsulated addition's attic. But you can't unless that roof leak is fixed! The addition is only 150 sqft. It would cost $135 to insulate just that back attic. Which means you could spend up to $206 repairing that leaky water heater vent.
If there is an activity that doesn't have a spending limit (insulating a mobile home belly, installing insider storm windows, or minor air sealing), that means there can be no incidental repairs associated with those activities.
ASHRAE 62.2
There was also a couple small changes on the 62.2 calculation tool. The chart was tweaked to show 10 cfm increments instead of 20 cfm. The other change was in the guidance for combustion air. The 62.2 tool was never meant to be the means that combustion air was calculated. But the math was already there for the ventilation sizing, so it made some sense to mention if the house was above or below .4 ACH.
Just because a house is tighter than .4 ACH doesn't mean there isn't enough combustion air. There are other methods of determining how much combustion air is needed based on the known infiltration rate of the house and the btus of the appliances. The form is now more specific in letting the user know if the house is below .4 ACH, that further investigation is needed to determine if there is sufficient combustion air for the appliances, just as it always has been.
Maine is doing it, are you?
The house the auditor describes could be located in the sandy soils of northwest Indiana. The part that caught my eye was this:
It is always encouraging to see actual energy consumption as a part of the auditing and overall weatherization process. Maine is doing it, are you?
A little background: the low income weatherization program insulates and weatherizes homes of folks who qualify for heating assistance. MSHA evaluates the houses and tackles the “worst” ones using highest BTUs per square foot per heating degree day as criteria. Then they apply their limited budget to insulating and weatherizing the building.
It is always encouraging to see actual energy consumption as a part of the auditing and overall weatherization process. Maine is doing it, are you?
Saturday, May 18, 2013
Wx's long tradition of cheap & good enough diagnostics
Back in my old BSU days Dr. Hill made great efforts to get as many diagnostic tools into our hands as possible. It was always fun to use a DIY tool. The all time greatest DIY tool is the cardboard stack effect box. It is about the only good use for a 150 W bulb! Take a tall cardboard box with a light fixture at the bottom. Give it a few minutes to heat the air in the box up, and with a little chemical smoke and some smallish holes at the top and bottom, you can clearly see the air moving into the box's 'foundation' and out the box's 'roof'!
In a pinch a well taped cardboard box will work as a pressure pan. Cut a hole in the cardboard pressure pan and now you've got an exhaust flow hood. Then there is the calibrated air flow gauge. Also known as a trash bag. It is good to hear ACI can call back to some of its earlier, less refined roots!

There are approximately 1.7 cubic feet in 13 gallons. So if you have an exhaust fan moving 30 cfm of air, it would take about three and a half seconds for a 13 gallon trash bag full of air to be completely empty if that fan were moving 30 cfm of air. While the volume of the bag is well known, it must be full of air or the accuracy is reduced. Another source of error is the timing of how long it takes to suck (or inflate) the bag. The more air the fan is moving, the less time there is to measure.
So if you happen to forget your TEC exhaust fan flow hood, ask for a large trash bag and a metal coat hanger if you are in a pinch. Or, if you've got rooms with comfort issues, see how long it takes to fill the trash bag up. That can give you a good feel for how many cfm the duct is delivering.
In a pinch a well taped cardboard box will work as a pressure pan. Cut a hole in the cardboard pressure pan and now you've got an exhaust flow hood. Then there is the calibrated air flow gauge. Also known as a trash bag. It is good to hear ACI can call back to some of its earlier, less refined roots!
There are approximately 1.7 cubic feet in 13 gallons. So if you have an exhaust fan moving 30 cfm of air, it would take about three and a half seconds for a 13 gallon trash bag full of air to be completely empty if that fan were moving 30 cfm of air. While the volume of the bag is well known, it must be full of air or the accuracy is reduced. Another source of error is the timing of how long it takes to suck (or inflate) the bag. The more air the fan is moving, the less time there is to measure.
So if you happen to forget your TEC exhaust fan flow hood, ask for a large trash bag and a metal coat hanger if you are in a pinch. Or, if you've got rooms with comfort issues, see how long it takes to fill the trash bag up. That can give you a good feel for how many cfm the duct is delivering.
Wednesday, May 8, 2013
New Site Built and Mobile Home Priority lists - Incidental Repairs!
If you haven't heard from IHCDA already, DOE has approved a new method of determining how much can be spent on incidental repairs associated with energy conservation activities. I won't go into the details much, as IHCDA is taking the lead on that front. Just ask Ray to explain how it works. I do want everyone to know that the new hard copy versions of the work orders have been on the Intelligent Weatherization site for a short while.
Updated versions of the digital job books should follow, but not in the immediate future. Between Add a Hole field training, University of Illinois ventilation research and other field trainings, it is looking like it would be the end of the month at the very earliest before any of those are updated. Speaking of the Add a Hole training, there is a new line in the pressure diagnostics page of the site built work order form where zonal cfm leakage rates can be documented. Before the new work orders are integrated into the digital job books, there are other electronic forms that are due for some user interface changes. Tom Andrews is doing an excellent job of beta testing these electronic versions of the forms and finding some bugs and UI tweaks that could be made. Be on the lookout for some updates to the 62.2 spreadsheet...
Updated versions of the digital job books should follow, but not in the immediate future. Between Add a Hole field training, University of Illinois ventilation research and other field trainings, it is looking like it would be the end of the month at the very earliest before any of those are updated. Speaking of the Add a Hole training, there is a new line in the pressure diagnostics page of the site built work order form where zonal cfm leakage rates can be documented. Before the new work orders are integrated into the digital job books, there are other electronic forms that are due for some user interface changes. Tom Andrews is doing an excellent job of beta testing these electronic versions of the forms and finding some bugs and UI tweaks that could be made. Be on the lookout for some updates to the 62.2 spreadsheet...
Sunday, April 28, 2013
Chemical sensitivity is no joke
Is anybody using any of the two part foam products mentioned in the article? I'm not familiar with Demilec, but I don't work with foam on a regular basis...

While the suit is about post-installation issues with the foam, those same sensitivities are even more likely while the foam is being sprayed. Be safe when spraying!
While the suit is about post-installation issues with the foam, those same sensitivities are even more likely while the foam is being sprayed. Be safe when spraying!
Tuesday, April 16, 2013
A few additional views on indoor ventilation
This article discussing ASHRAE's ventilation requirement brought up some new viewpoints I hadn't heard before (looking towards the end of the article). I know there is some contention about the CFM number the standard generates being too high or too low. I do like that the article mentioned the wide variety of indoor activities that can make 'too high' and 'too low' arguments both valid.
I'm not installing or sizing fans on a daily basis, so I don't have a feel for what the average spec'd flow rate is for a post-weatherization house. I'd guess a large number of post-weatherization houses come in under 55 cfm continuous. This leads me to think that the ability to vary a fan's hourly flow (either directly from the fan or with a timer) is a pretty important detail. Joe Lstiburek is mentioned in the article recommending a fan be sized to 150% of the sized flow rate, but initially setting them at 50% of the flow rate. I don't know if that procedure would be able to fit in weatherization's policies. But in a high performance private sector situation, that would make lots of sense along with a little customer education. The house wouldn't be over ventilated, but there would be additional capacity to ramp up with additional loads (humidity, indoor pets, or plain old bad smells) if the situation should warrant it.
I'm not installing or sizing fans on a daily basis, so I don't have a feel for what the average spec'd flow rate is for a post-weatherization house. I'd guess a large number of post-weatherization houses come in under 55 cfm continuous. This leads me to think that the ability to vary a fan's hourly flow (either directly from the fan or with a timer) is a pretty important detail. Joe Lstiburek is mentioned in the article recommending a fan be sized to 150% of the sized flow rate, but initially setting them at 50% of the flow rate. I don't know if that procedure would be able to fit in weatherization's policies. But in a high performance private sector situation, that would make lots of sense along with a little customer education. The house wouldn't be over ventilated, but there would be additional capacity to ramp up with additional loads (humidity, indoor pets, or plain old bad smells) if the situation should warrant it.
Thursday, April 11, 2013
How to cope with a poor use of props *Updated*
First, some kudos. It was a pleasant surprise to see Ray Judy on the TV the other day. (It looks like the video in the WTHR link is still a bit glitchy.) He did a good job stressing the importance of air sealing before adding insulation.
Unfortunately, the camera then cuts to the reporter holding a of tube of caulk. Foam guns are cool looking! Show a foam gun! Even a little can of Great Stuff would be an improvement...
Come on Indy! Chicago has it figured out (go Meena!).
On a slightly related note, it is a bit puzzling to me why Indiana would be running out of all the "cheap" gas already. The tiny bit of reading I've done leads me to believe (not being an expert) that most of the fracking contracts that were producing vast amounts of cheap natural gas were long term contracts. As in we'd be enjoying cheap gas for the next 3-4 years. I can see gas bills being higher this month due to the increased number of heating degree days relative to last year. But the article specifically says the increase in cost is due to new gas costs.
Oh, and don't set your thermostat to 72 degrees in the summer and expect to see big electric savings. I wonder if that was deliberate misinformation from the gas companies to raise electric bills or if the error was on the reporter? Regardless, 78 degrees is just barely comfortable for most people in the summer and would be a setting that would help keep cooling costs lower.
*UPDATE*
It looks like WTHR combined information from Citizens Energy Group and Vectren when giving reasons why your gas bill will be higher in April. WISHTV has an article that covers Vectren and not CEG. According to Vectren, they are citing the colder weather as the reason for the higher bills, not an increase in the wholesale cost to the utility.
Tuesday, April 2, 2013
All I want to know is when does the Android app come out?
It looks like TEC is working on a wifi (Bluetooth?) dongle for their digital manometer (note the little blue LED on top). Something like this would make add a hole testing a little easier. Especially if the app relays the cfm50 number. Just set the gauge up, bring your phone and walk through the house opening holes and noting what the new pressure differentials are and the new cfm50 is.
 The price tag seems a little high ($275), but not unbearable. According to Energy Vanguard the dongle is expected to be released in June.
Monday, April 1, 2013
For those of you in the know...
During the 2010 - 2011 DOE grant cycle INCAA was a subcontractor for two weatherization providers, WECC and CAPWI. That is obviously a conflict of interest for INCAA to evaluate and report on homes that INCAA also weatherized. To alleviate that conflict, Dr. William Hill was hired to perform an independent analysis of those houses that INCAA 'touched' either as a whole house contractor, or as an auditor. His independent analysis can be found here.
Thursday, March 28, 2013
2010 - 2011 Indiana Billing Analysis Report
2010 - 2011 Indiana Billing Analysis Report
The billing analysis report for homes weatherized between April 1, 2010 and March 31, 2011 has been released. Some of the highlights:

First, a little optimism. Over two thirds of the providers were able to average savings greater than 20% for natural gas consumption. Something to bear in mind when looking at these charts. The Indiana Builder's Association (IBA) weatherized one in three houses during this time period. So the IBA is going to have a significant impact on all the state averages. That explains why the state average is so low relative to the majority of the other providers. All those providers achieving more than 20% savings aren't weatherizing many homes, & don't have as big an effect on the state average.


Percent savings are a decent way of comparing different providers working on different homes in different parts of the state. But what matters is the number of therms/kWh saved. Because those translate into dollars. To keep the math simple, a therm of gas costs about $1 (actually, a little less, but go ahead and round up to keep the math less tedious).
Before anyone thinks of doing any cost/benefit analysis with the information above, please keep in mind that this is ONLY natural gas data. Before any cost/benefit type thoughts are even entertained, any electric savings should be included. Unfortunately, NIPSCO, Vectren, and a very large number of local utility providers were able to provide consumption data for this report. That leaves out three very large electric providers, which makes it difficult to say very much about total energy savings.
That said, averaging 166 therms shows there is room for improvement. Which isn't a surprise. Given the strains of ARRA production goals and bringing new providers online and up to speed, I'm surprised to see the average savings as high as it is.
One area I think could & should be improved is increasing the amount of energy consumed before the house is weatherized. Not every house getting weatherization needs to be an energy hog. But it is very difficult to squeeze big therm savings from a house that isn't using much energy in the first place.
There will be a few posts in the future looking at some details of this dataset that wouldn't fit well into the official report. But if anyone has any ideas of topics they would like to be further flushed out, please let me know in the comments or email me.
The billing analysis report for homes weatherized between April 1, 2010 and March 31, 2011 has been released. Some of the highlights:
- The state averaged 17.9% savings (+/- .4%); 166 therms annually (+/- 4 therms)
- The average provider annual therm savings ranged from over 400 therms (WECC) to less than 90 therms (PWC and HOW)
First, a little optimism. Over two thirds of the providers were able to average savings greater than 20% for natural gas consumption. Something to bear in mind when looking at these charts. The Indiana Builder's Association (IBA) weatherized one in three houses during this time period. So the IBA is going to have a significant impact on all the state averages. That explains why the state average is so low relative to the majority of the other providers. All those providers achieving more than 20% savings aren't weatherizing many homes, & don't have as big an effect on the state average.
Percent savings are a decent way of comparing different providers working on different homes in different parts of the state. But what matters is the number of therms/kWh saved. Because those translate into dollars. To keep the math simple, a therm of gas costs about $1 (actually, a little less, but go ahead and round up to keep the math less tedious).
Before anyone thinks of doing any cost/benefit analysis with the information above, please keep in mind that this is ONLY natural gas data. Before any cost/benefit type thoughts are even entertained, any electric savings should be included. Unfortunately, NIPSCO, Vectren, and a very large number of local utility providers were able to provide consumption data for this report. That leaves out three very large electric providers, which makes it difficult to say very much about total energy savings.
That said, averaging 166 therms shows there is room for improvement. Which isn't a surprise. Given the strains of ARRA production goals and bringing new providers online and up to speed, I'm surprised to see the average savings as high as it is.
One area I think could & should be improved is increasing the amount of energy consumed before the house is weatherized. Not every house getting weatherization needs to be an energy hog. But it is very difficult to squeeze big therm savings from a house that isn't using much energy in the first place.
There will be a few posts in the future looking at some details of this dataset that wouldn't fit well into the official report. But if anyone has any ideas of topics they would like to be further flushed out, please let me know in the comments or email me.
Tuesday, March 19, 2013
Billing Analysis reports from year's past
IHCDA's billing analysis report for homes weatherized between April 1, 2010 and March 31, 2011 is wrapping up. It should be finished by the end of the month along with each provider's Production Reports. In the mean time, here are links to some of the most recent state reports INCAA produced for IHCDA:
2007-2008
2008-2009
2009-2010 (includes the beginning of ARRA)
2007-2008
2008-2009
2009-2010 (includes the beginning of ARRA)
Handy little accessory for Wood stoves
There aren't very many Weatherized homes with wood burners as the main heat source (there were only 77 weatherized between April 1, 2010 and March 31, 2011). But for those few houses that do, this looks to be a low cost means of distributing some of that heat away from the stove.
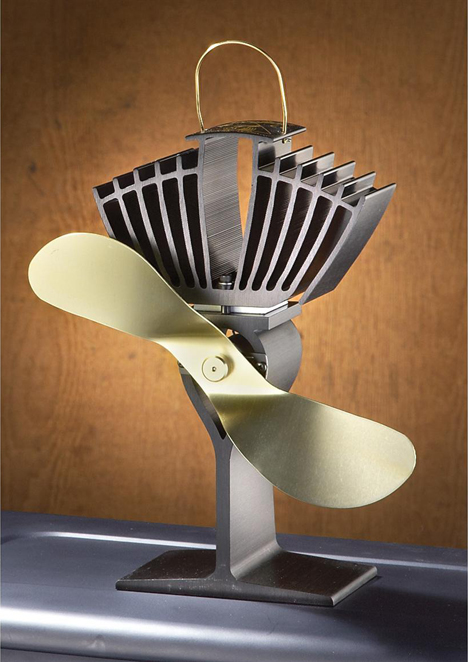
Any Weatherization providers participating in the Northern Indiana Wood Stove Changeout Program, it might be worth looking into.
Any Weatherization providers participating in the Northern Indiana Wood Stove Changeout Program, it might be worth looking into.
Wednesday, March 13, 2013
Affordable, simple IR (if it ever materializes...)
Any auditor or insulation tech knows how useful an infra red camera is when insulating sidewalls. There are some really fancy (read: expensive) models and other cameras that are more affordable, but have fewer bells & whistles. Here is a crowd sourced option that looks like it might fit into a Wx toolkit rather nicely.
Mu Thermal Camera

All you need is a spare iPhone, and the hope that the campaign to build it is successful. If you're feeling optimistic, there are still some slots open to buy one for $150 (plus S&H).
Mu Thermal Camera
All you need is a spare iPhone, and the hope that the campaign to build it is successful. If you're feeling optimistic, there are still some slots open to buy one for $150 (plus S&H).
Greetings!

A big part of my job is counting how many times these meter wheels spin each month. Every house that participates in Indiana's Energy Assistance Program or Weatherization as at least one meter counting how much energy is consumed each month. The main point of Weatherization is to slow down the little wheel in the meter that spins. Month by month, year by year, keeping homes warmer in the winter and making the homes more affordable by slowing that meter down.
Here you will find some musing on Indiana's Weatherization impacts, based on the meters in hundreds of homes here in Indiana. Or there might be a new technique or gadget related to energy conservation or building science that is mentioned. If a new form or tool used in Indiana's Weatherization program is released, it will be noted here as well.
Feel free to comment or send feedback.
Enjoy!
Dan Phillips
Subscribe to:
Posts (Atom)