Thursday, March 28, 2013

2010 - 2011 Indiana Billing Analysis Report

2010 - 2011 Indiana Billing Analysis Report

The billing analysis report for homes weatherized between April 1, 2010 and March 31, 2011 has been released.  Some of the highlights:

  • The state averaged 17.9% savings (+/- .4%); 166 therms annually (+/- 4 therms)
  • The average provider annual therm savings ranged from over 400 therms (WECC) to less than 90 therms (PWC and HOW)
On average, the legacy providers (providers that were weatherizing before IHCDA expanded the number of providers during ARRA) saved more therms than the new providers.  The legacy providers averaged about 189 therms annually.  The new providers averaged about 141 therms annually. 


First, a little optimism.  Over two thirds of the providers were able to average savings greater than 20% for natural gas consumption.  Something to bear in mind when looking at these charts.  The Indiana Builder's Association (IBA) weatherized one in three houses during this time period.  So the IBA is going to have a significant impact on all the state averages.  That explains why the state average is so low relative to the majority of the other providers.  All those providers achieving more than 20% savings aren't weatherizing many homes, & don't have as big an effect on the state average.


Percent savings are a decent way of comparing different providers working on different homes in different parts of the state.  But what matters is the number of therms/kWh saved. Because those translate into dollars.  To keep the math simple, a therm of gas costs about $1 (actually, a little less, but go ahead and round up to keep the math less tedious). 

Before anyone thinks of doing any cost/benefit analysis with the information above, please keep in mind that this is ONLY natural gas data.  Before any cost/benefit type thoughts are even entertained, any electric savings should be included.  Unfortunately, NIPSCO, Vectren, and a very large number of local utility providers were able to provide consumption data for this report.  That leaves out three very large electric providers, which makes it difficult to say very much about total energy savings. 

That said, averaging 166 therms shows there is room for improvement.  Which isn't a surprise.  Given the strains of ARRA production goals and bringing new providers online and up to speed, I'm surprised to see the average savings as high as it is. 

One area I think could & should be improved is increasing the amount of energy consumed before the house is weatherized.  Not every house getting weatherization needs to be an energy hog.  But it is very difficult to squeeze big therm savings from a house that isn't using much energy in the first place. 

There will be a few posts in the future looking at some details of this dataset that wouldn't fit well into the official report.  But if anyone has any ideas of topics they would like to be further flushed out, please let me know in the comments or email me.

Tuesday, March 19, 2013

Billing Analysis reports from year's past

IHCDA's billing analysis report for homes weatherized between April 1, 2010 and March 31, 2011 is wrapping up.  It should be finished by the end of the month along with each provider's Production Reports.  In the mean time, here are links to some of the most recent state reports INCAA produced for IHCDA:

2007-2008

2008-2009

2009-2010 (includes the beginning of ARRA)

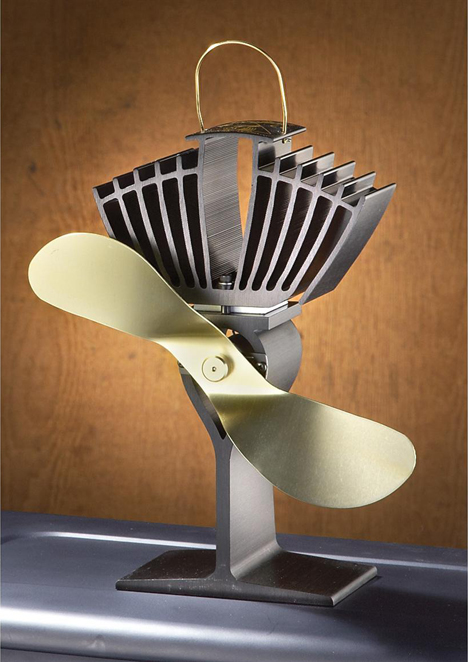
Handy little accessory for Wood stoves

There aren't very many Weatherized homes with wood burners as the main heat source (there were only 77 weatherized between April 1, 2010 and March 31, 2011).  But for those few houses that do, this looks to be a low cost means of distributing some of that heat away from the stove. 


Any Weatherization providers participating in the Northern Indiana Wood Stove Changeout Program, it might be worth looking into. 

Wednesday, March 13, 2013

Affordable, simple IR (if it ever materializes...)

Any auditor or insulation tech knows how useful an infra red camera is when insulating sidewalls.  There are some really fancy (read: expensive) models and other cameras that are more affordable, but have fewer bells & whistles.  Here is a crowd sourced option that looks like it might fit into a Wx toolkit rather nicely.

Mu Thermal Camera


All you need is a spare iPhone, and the hope that the campaign to build it is successful.  If you're feeling optimistic, there are still some slots open to buy one for $150 (plus S&H).

Combustion Lab photosphere

INCAA's Combustion Lab is viewable as a Google photosphere.  

Greetings!


A big part of my job is counting how many times these meter wheels spin each month.  Every house that participates in Indiana's Energy Assistance Program or Weatherization as at least one meter counting how much energy is consumed each month.  The main point of Weatherization is to slow down the little wheel in the meter that spins.  Month by month, year by year, keeping homes warmer in the winter and making the homes more affordable by slowing that meter down.

Here you will find some musing on Indiana's Weatherization impacts, based on the meters in hundreds of homes here in Indiana.  Or there might be a new technique or gadget related to energy conservation or building science that is mentioned.  If a new form or tool used in Indiana's Weatherization program is released, it will be noted here as well.

Feel free to comment or send feedback.

Enjoy!

Dan Phillips